Create Account
Sign up with Google
Sign up with Facebook
Or
Email
Password
Send me handpicked vectors, photos, and video recommendations
By signing up you accept our
Privacy Policy
,
Terms
&
Licensing Agreement
.
This site is protected by reCAPTCHA and the Google
Privacy Policy
and
Terms of Service
apply.
Create Account
Already have an account?
Log In →
Log In
Login with Google
Login with Facebook
Or
Username / Email
Password
This site is protected by reCAPTCHA and the Google
Privacy Policy
and
Terms of Service
apply.
Log In
Forgot Your Password?
Don't have an account?
Create one
Reset Password
Account Email Address
Reset Password
← Back to Log In
Single Sign-on
Log in with your team's identity provider:
Your Vecteezy Team ID
Continue
← Back to Log In
Instantly Download From Search Results with Pro, Plus
Gain Access to 60+ Million Images, Videos & More
Enjoy a Seamless, Ad-Free Browsing Experience
Get Full Commercial Rights & Legal Coverage
Receive Unlimited Royalty-Free Downloads
Unlimited 4K Video Downloads
Create Account
Sign up with Google
Sign up with Facebook
Or
Email
Password
Send me handpicked vectors, photos, and video recommendations
By signing up you accept our
Privacy Policy
,
Terms
&
Licensing Agreement
.
This site is protected by reCAPTCHA and the Google
Privacy Policy
and
Terms of Service
apply.
Create Account & Continue to Download
Already have an account?
Log In →
Getting started...
Vecteezy logo
Vecteezy logo
Vectors
Expand vectors navigation
Trending Searches
Top Searches
Backgrounds
Banners
Plants
Flowers
Pattern
Wedding
People
Landscape
Photos
Expand photos navigation
Trending Searches
Top Searches
Nature
Lifestyle
Animals
Food & Drink
Travel
Business
Textures
Cityscapes
Videos
Expand videos navigation
Trending Searches
Top Searches
Family
Timelapses
Animals
Travel
Lifestyle
Aerials
Nature
Backgrounds
Editorial
Expand editorial navigation
News
Sports
Entertainment
More
Expand more navigation
Motion Graphics
Titles
Logos
Backgrounds
Transitions
See more Motion Graphics
Templates
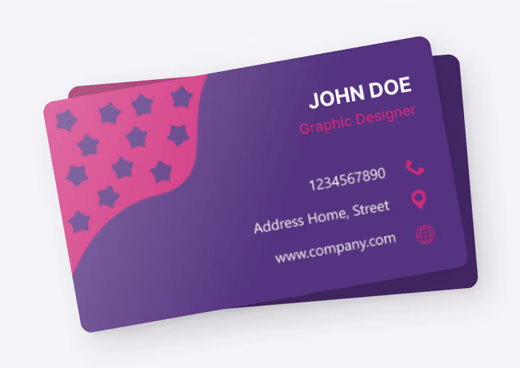
Business Cards
Resumes
Greeting Cards
Instagram Posts
See more Templates
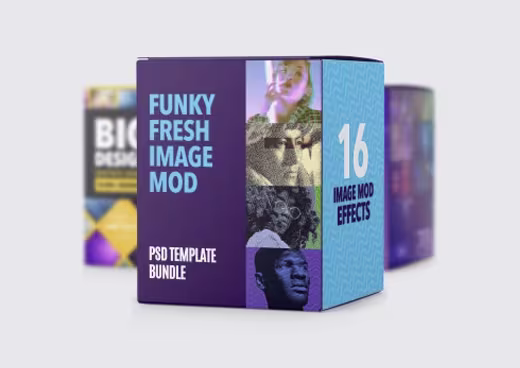
Bundles
5000+ Backgrounds Mega Bundle
450 Abstract Paint Backgrounds Bundle
100 Abstract Backgrounds Bundle
Premium Handwritten Fonts Bundle
See more Bundles
SVGs
Logos
Flowers
Hearts
Arrows
See more SVGs
PNGs
Flower
Frame
Heart
Tree
See more PNGs
PSDs
Logos
Banners
Text Effects
Business Cards
See more PSDs
My Collections
Plans
Plans
Vectors
Trending Searches
Backgrounds
Banners
Plants
Flowers
Pattern
Wedding
People
Landscape
Vector Pages
Homepage
Top Searches
Photos
Trending Searches
Nature
Lifestyle
Animals
Food & Drink
Travel
Business
Textures
Cityscapes
Photo Pages
Homepage
Top Searches
Videos
Trending Searches
Family
Timelapses
Animals
Travel
Lifestyle
Aerials
Nature
Backgrounds
Video Pages
Homepage
Top Searches
Editorial
Homepage
News
Sports
Entertainment
More
Motion Graphics
Templates
Bundles
SVGs
PNGs
PSDs
My Collections
Sign Up
Free
Log In
0
Plans
Sign Up
Free
Log In
Videos
Expand filters
All Images
Photos
PNGs
PSDs
SVGs
Templates
Vectors
Videos
Motion Graphics
Editorial Images
Editorial Events
Search by Image
Search
Explore Other Popular Video Searches
Recent searches
Share on Pinterest
Simple flat illustration of a bar chart graph. Depicts increase and decrease in data values over time. Pro Video
MD KAOSAR JAHID
31,379 Resources
Follow
Free with Trial
No Attribution Required
Original 1080p
(h264 QuickTime )
1080p
(h.264 mp4)
720p
(h.264 mp4)
Bookmark icon
Collection
Share on Pinterest icon
Pin
Similar icon
Similar
Share icon
Share
Checkmark icon
Pro Standard License
What's This?
More Info
Pro Content
Why Pro?
Resolution:
HD 1920x1080
File Type:
QuickTime
Codec:
h264
Frame Rate:
30 FPS
Aspect Ratio:
16:9
Duration:
00:10
Related Keywords