Toggle filters
    Photos
    Expand filters
    • Search by Image
    Reset color
    Toggle filters
    Photos
    Expand filters
    • Search by Image
    Reset color

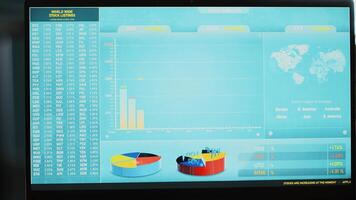
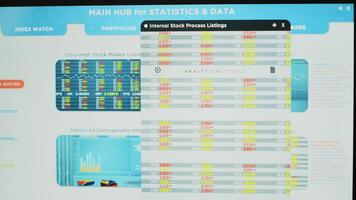
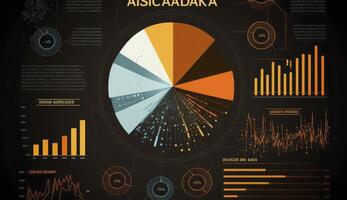
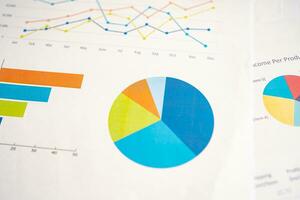
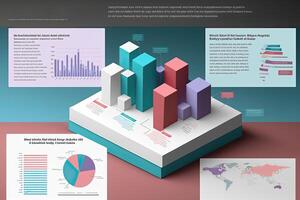
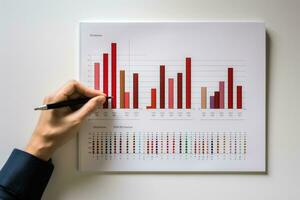
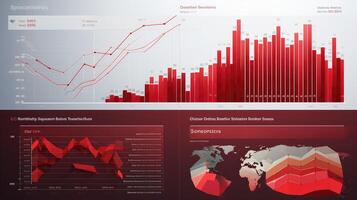
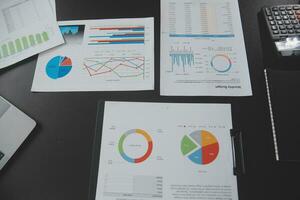
    Statistics Infographic Photos & Images

     - 2,450 high resolution, royalty free stock photos and pictures matching Statistics Infographic

    of 25
    • statistics book infographic photo
    • Graphs paper. Financial development, Banking Account, Statistic, Investment Analytic research data economy. photo
    • chart or graph paper. Financial, account, statistics and business data concept. photo
      Free
    • Business chart with line graph, bar chart and numbers on dark background, 3d rendering photo
    • Business chart with line graph, bar chart and numbers on dark background, 3d rendering photo
    • chart or graph paper. Financial, account, statistics and business data concept. photo
    • Laptop screen in business office shows stock exchange values changing in real time, close up. Notebook in workplace with trading indexes showing prices and pie charts graphs, zoom in photo
    • Office with laptop showing stock exchange listings and display in background with client appointments list. Notebook with trading platform indexes and customers commissions table in the back photo
    • Colorful bar graph representing data trends and analysis for effective decision-making. photo
    • chart or graph paper. Financial, account photo
    • A person holding a smartphone horizontally on the screen showing the cart image and the message online shopping, a concept image for use in online merchandising advertisements. copy space. photo
      Free
    • Charts Graphs paper. Financial development, Banking Account, Statistics, Investment Analytic research data economy, Stock exchange Business office company meeting concept. photo
      Free
    • A blue pie chart with digital earth, 3d rendering. photo
    • 3d rendering, graph chart background, business graph photo
    • 3d rendering, graph chart background, business graph photo
    • Ring diagram and bar diagram, 3d rendering. photo
    • A green businessrelated line graph on an arrows background file format photo
    • Business chart with line graph, bar chart and numbers on dark background, 3d rendering photo
    • Investment and finance concept illustration, 3d rendering. photo
    • Big data analytics report. Infographic with graph and chart on abstract background. Distribution of data by business categories. Created with photo
      Free
    • 3d rendering, graph chart background, business graph photo
    • Business chart with line graph, bar chart and numbers on dark background, 3d rendering photo
    • Working place, wooden table photo
    • 3d rendering, graph chart background, business graph photo
    • Pen on chart or graph paper. Financial, account, statistics and business data concept. photo
    • Big data analytics report. Infographic with graph and chart on abstract background. Distribution of data by business categories. Created with photo
      Free
    • graph paper in business finance photo
    • Big data analytics report. Infographic with graph and chart on abstract background. Distribution of data by business categories. Created with photo
    • Chart graph paper. Finance, account, statistic, investment data economy, stock exchange business. photo
    • Big data analytics report. Infographic with graph and chart on abstract background. Distribution of data by business categories. Created with photo
    • Charts Graphs paper. Financial development, Banking Account, Statistics, Investment Analytic research data economy, Stock exchange Business office company meeting concept. photo
    • 3D rendering graph and pie chart. 3D illustration data concept on white background photo
    • Charts Graphs paper. Financial development, Banking Account, Statistics, Investment Analytic research data economy, Stock exchange Business office company meeting concept. photo
    • Statistics and data analysis. Investment. Business analysis using charts and graphs. Man studying statistics. Generated by artificial intelligence photo
    • Business finance data analysis chart. Financial management technology. Virtual screen. Generated by artificial intelligence photo
    • product chart data photo
    • graph annual report red photo
    • Drawing on dotted paper photo
    • 3D rendering, 3D illustration. Business chart. Ascending graph for growth forward. Concept of economy graph, histograms, statistics photo
    • Charts Graphs paper. Financial development, Banking Account, Statistics, Investment Analytic research data economy, Stock exchange Business office company meeting concept. photo
    • Business Line graph photo
    • 3D rendering, 3D illustration. Business chart. Ascending graph for growth forward. Concept of economy graph, histograms, statistics photo
    • Financial analysts analyze business financial reports on a digital tablet planning investment project during a discussion at a meeting of corporate showing the results of their successful teamwork. photo
    • pie chart blue and white for business concept 3d rendering photo
    • chart or graph paper. Financial, account, statistics and business data concept. photo
    • Big data analytics report. Infographic with graph and chart on abstract background. Distribution of data by business categories. Created with photo
      Free
    • Graphs paper. Financial development, Banking Account, Statistic, photo
    • Charts Graphs paper. Financial development, Banking Account, Statistics, Investment Analytic research data economy, Stock exchange Business office company meeting concept. photo
    • Chart or graph paper. Financial, account, statistic and business data concept. photo
    • quartiles box chart photo
    • Statistics and data analysis. Investment. Business analysis using charts and graphs. Man making diagrams. Generated by artificial intelligence photo
      Free
    • Business desk with business notebook, graph paper, pen on desk, top view with copy space. photo
    • A graph chart and a business report photo
    • Increasing bar graph colour shading for investment trading on stock market and business growth concept by 3d render. photo
    • sleek infographic red black photo
    • multicoloured pie chart 3d rendering on white background for business content. photo
    • laptop and financial graph on white paper on working table photo
    • trend charts and tables photo
    • Big data analytics report. Infographic with graph and chart on abstract background. Distribution of data by business categories. Created with photo
      Free
    • Chart graph paper. Finance, account, statistic, investment data economy, stock exchange photo
    • Business documents chart and graph finance statistic with pen.Paperwork report diagram investment and analysis information accounting marketing plan concept. photo
      Free
    • 3D render, 3D illustration. Pie chart infographic icon. Simple circle diagram graph icon on white background. financial data presentation concept. photo
    • appreciation thank you data photo
    • Miniature figures businessmen standing on a graph chart financial photo
      Free
    • Global business strategy planning using world map and data charts photo
    • chpopulation radial data photo
    • Data visualization with pie chart and bar graph photo
    • growth data chart infographic photo
    • Charts Graphs paper. Financial development, Banking Account, Statistics, Investment Analytic research data economy, Stock exchange Business office company meeting concept. photo
      Free
    • metrics 4 box infographic photo
    • cybersecurity red infographics photo
    • chart or graph paper. Financial, account, statistics and business data concept. photo
      Free
    • Business Line graph photo
    • Ai generation 3d isometric business statistics, pie chart and graph. Financial and investment concepts photo
      Free
    • Ai generation 3d isometric business statistics, pie chart and graph. Financial and investment concepts photo
      Free
    • Graphs paper. Financial development, Banking Account, Statistic, Investment photo
    • increase red infographics photo
    • Ai generation 3d isometric business statistics, pie chart and graph. Financial and investment concepts photo
      Free
    • Ai generation 3d isometric business statistics, pie chart and graph. Financial and investment concepts photo
      Free
    • industry cannabis data photo
    • Ai generation 3d isometric business statistics, pie chart and graph. Financial and investment concepts photo
      Free
    • Ai generation 3d isometric business statistics, pie chart and graph. Financial and investment concepts photo
      Free
    • Chart graph paper. Finance, account, statistic, investment data economy, stock exchange busi photo
    • screen infographic blue photo
    • Ai generation 3d isometric business statistics, pie chart and graph. Financial and investment concepts photo
      Free
    • Business Line graph photo
    • Data visualization dashboard with charts and graphs showing business analytics photo
    • Data analysis and financial report photo
    • Ai generation 3d isometric business statistics, pie chart and graph. Financial and investment concepts photo
      Free
    • Business Line graph photo
    • chart or graph paper. Financial, account, statistics and business data concept. photo
      Free
    • Graph Calculations, savings, finances and economy concept photo
      Free
    • Financial graphs and charts on a wooden table photo
      Free
    • Ai generation 3d isometric business statistics, pie chart and graph. Financial and investment concepts photo
      Free
    • Ai generation 3d isometric business statistics, pie chart and graph. Financial and investment concepts photo
      Free
    • Ai generation 3d isometric business statistics, pie chart and graph. Financial and investment concepts photo
      Free
    • Charts Graphs paper. Financial development, Banking Account, Statistics, Investment Analytic research data economy, Stock exchange Business office company meeting concept. photo
      Free
    • Documents on white background photo
      Free