
A great infographic makes complex data easier to grasp. The right mix of charts, icons, and visual elements turns boring statistics into something more interesting and worth sharing.
Pre-designed elements can make your infographic design much faster and easier. Here at Vecteezy, we offer a massive collection of vectors, icons, and graphics that can elevate your infographic designs instantly. This article showcases some examples of elements that could be put to good use in your infographic designs. Of course, the exact elements you’ll need will depend on the specific data you’re showcasing, but chances are, you’ll find plenty of options at Vecteezy.
Core Infographic Elements
These are the building blocks that work across virtually any infographic topic. With these elements at your disposal, you’ll have a solid foundation for any project.
Data Visualization Components
Many infographics feature charts and graphs. Vecteezy’s collection of data visualization graphics includes everything you need.
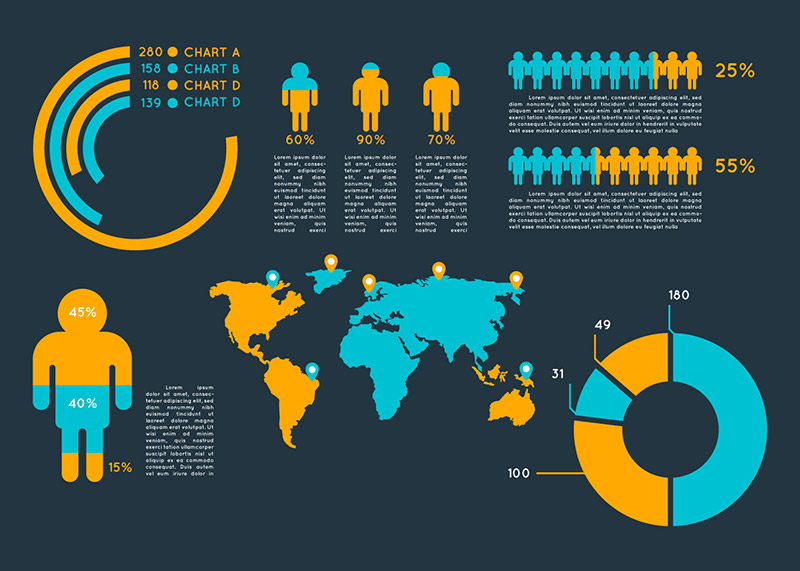
By Rizki Kurniawan
Timeline vectors help you show progression or historical context.

By Inactive Design
Step diagrams and numbered banners break down processes into digestible chunks.

By carterart
Navigation & Flow Elements
Guide your viewer’s eye through your infographic with directional elements. Arrows and checkmarks are among the most commonly used elements for infographic designs. Speech bubbles add emphasis to key points or quotes, while mind maps help visualize connections and flow.
Get millions of stock images and videos at the best price
Unlimited access. No attribution required. Starts at just $9/month.

By Galih Warsita Rahman
Visual Organization Tools
Structure and hierarchy make infographics scannable. Basic shapes serve as containers for text and data, while badges add visual interest. For a more creative touch, ripped paper effects can serve as visual dividers between sections.

By Aditia A. Prasetya
Maps
If your infographic includes data for specific countries or states, vector maps are extremely useful.

By novan103403592
Icons for Common Infographic Topics
Of course, your infographic designs must be relevant to the topic or industry associated with the data or target audience. Here are some elements for popular infographic themes.
Business & Finance Infographics
Use elements like business people illustrations, money icons, and office icons.
By Andres Ramos
Social Media & Digital Marketing
Social media icons are often needed, while emojis and smiley faces may be appropriate for certain projects.
By MD SHAHIN MIAH
Education & Learning
Educational infographics come alive with school buildings, pencils, school clipart, and other things typically associated with education, schools, and students.

By Aleksandra Bozhbova
Health & Medical
Hospital clipart, medical icons, and wellness icons can be used for infographics in a wide range of topics related to health, wellness, and medicine.
By Giuseppe Ramos
Nature & Environment
Environmental and sustainability topics may benefit from tree outlines, leaf outlines, cloud clipart, sky backgrounds, and more.

By Ekaterina Krupina
Other Vectors
Of course, the elements listed and shown above are just the beginning. Heart outlines could be perfect for Valentine’s Day-themed infographics, music notes are ideal for any musical designs, and family clipart works for demographics, parenting topics, or household statistics.

By Shinevect
Start Creating Your Next Infographic
With these elements in your toolkit, you’re ready to transform data and ideas into compelling visuals. Start exploring these categories and search Vecteezy for other elements that would be useful in your infographic designs.